Posts
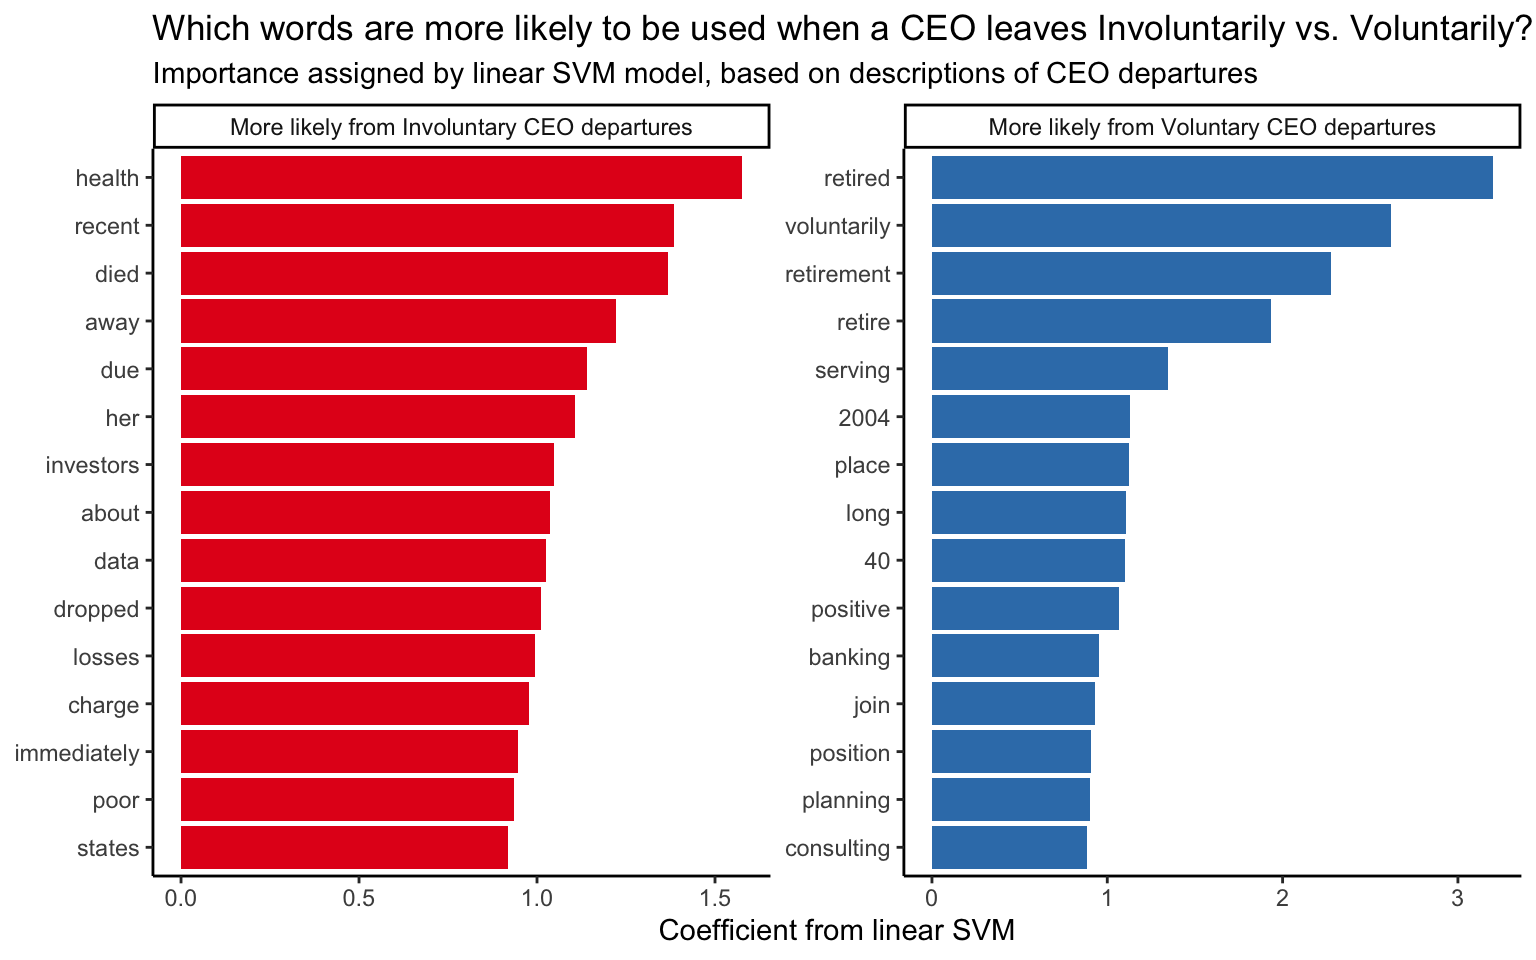
Predicting voluntary CEO departures using machine learning
Graphs and analysis using the #TidyTuesday data set for week 18 of 2021 (27/4/2021): "CEO Departures"
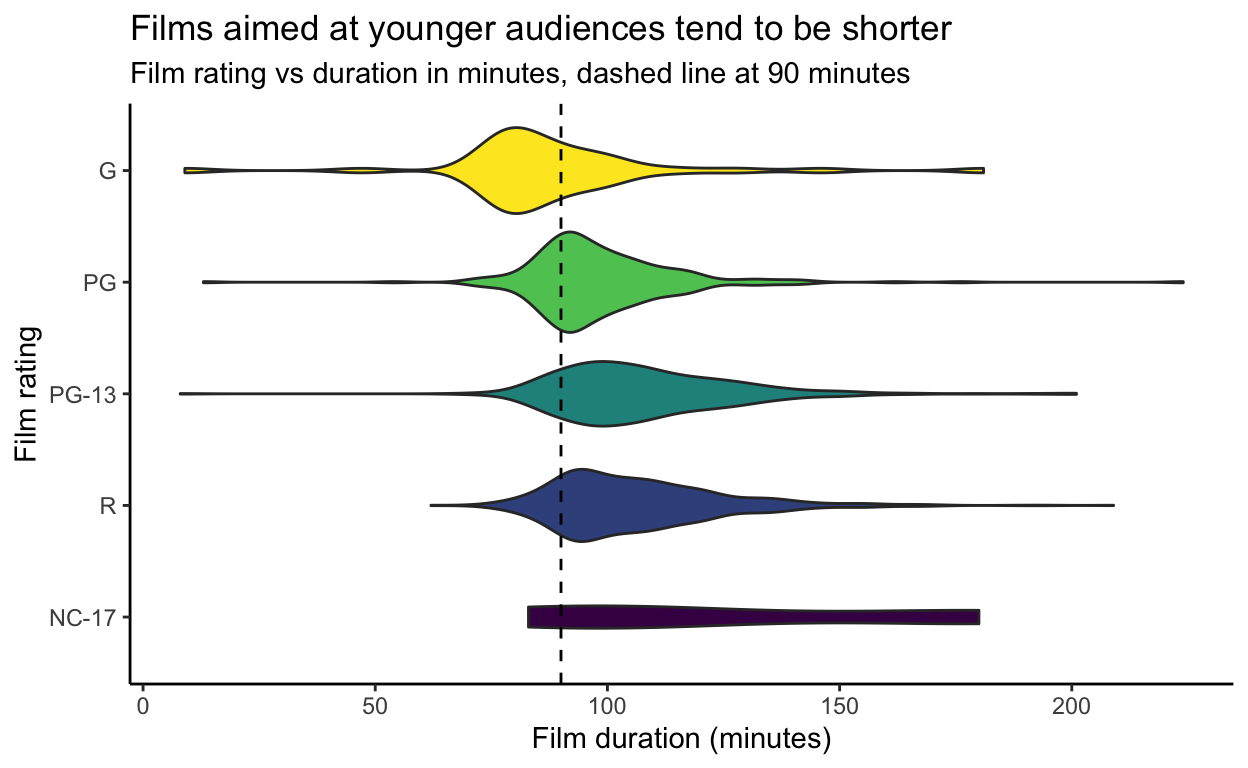
Films with MPA ratings on Netflix
Graphs and analysis using the #TidyTuesday data set for week 17 of 2021 (20/4/2021): "Netflix Titles"
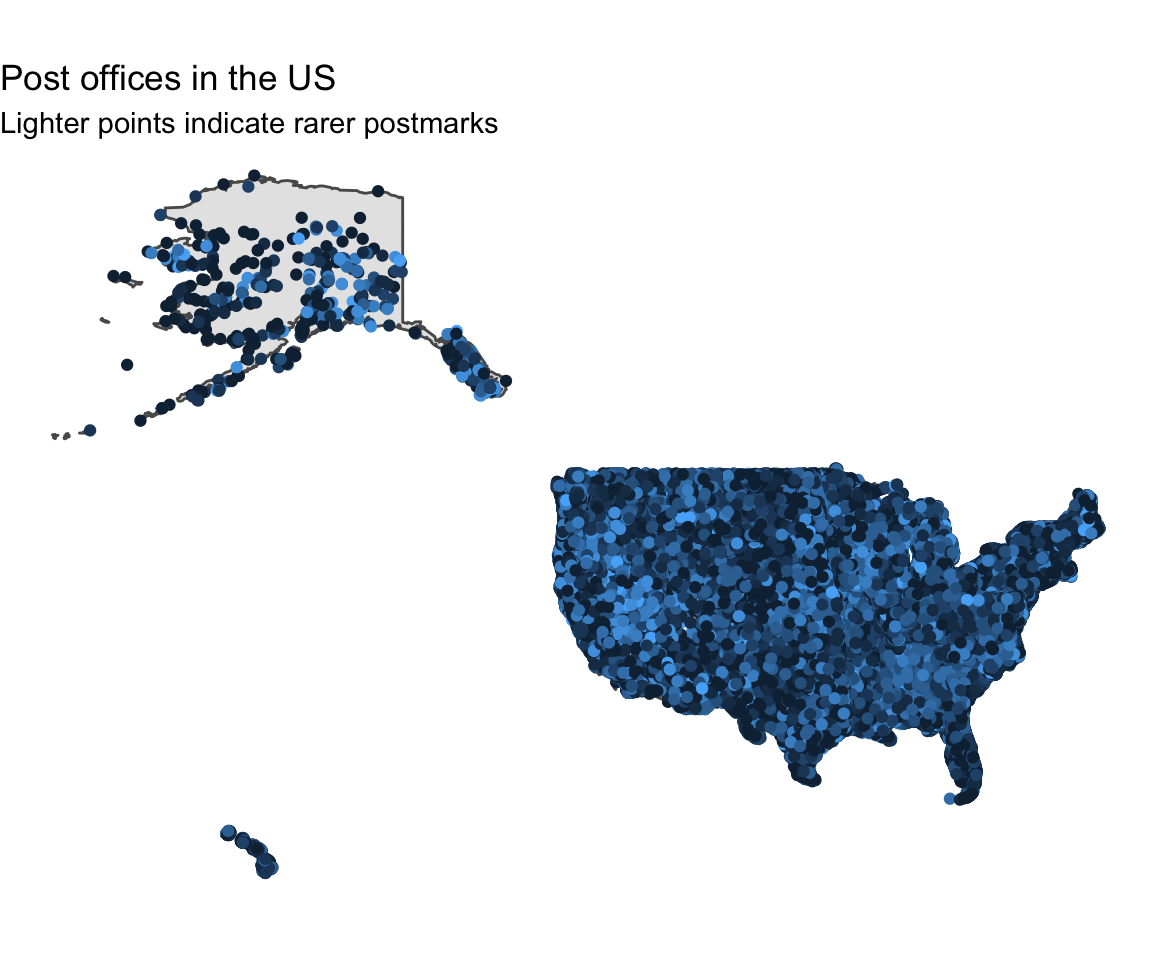
Post offices in the USA from 1772 to 2000
Graphs and analysis using the #TidyTuesday data set for week 16 of 2021 (13/4/2021): "US post offices"
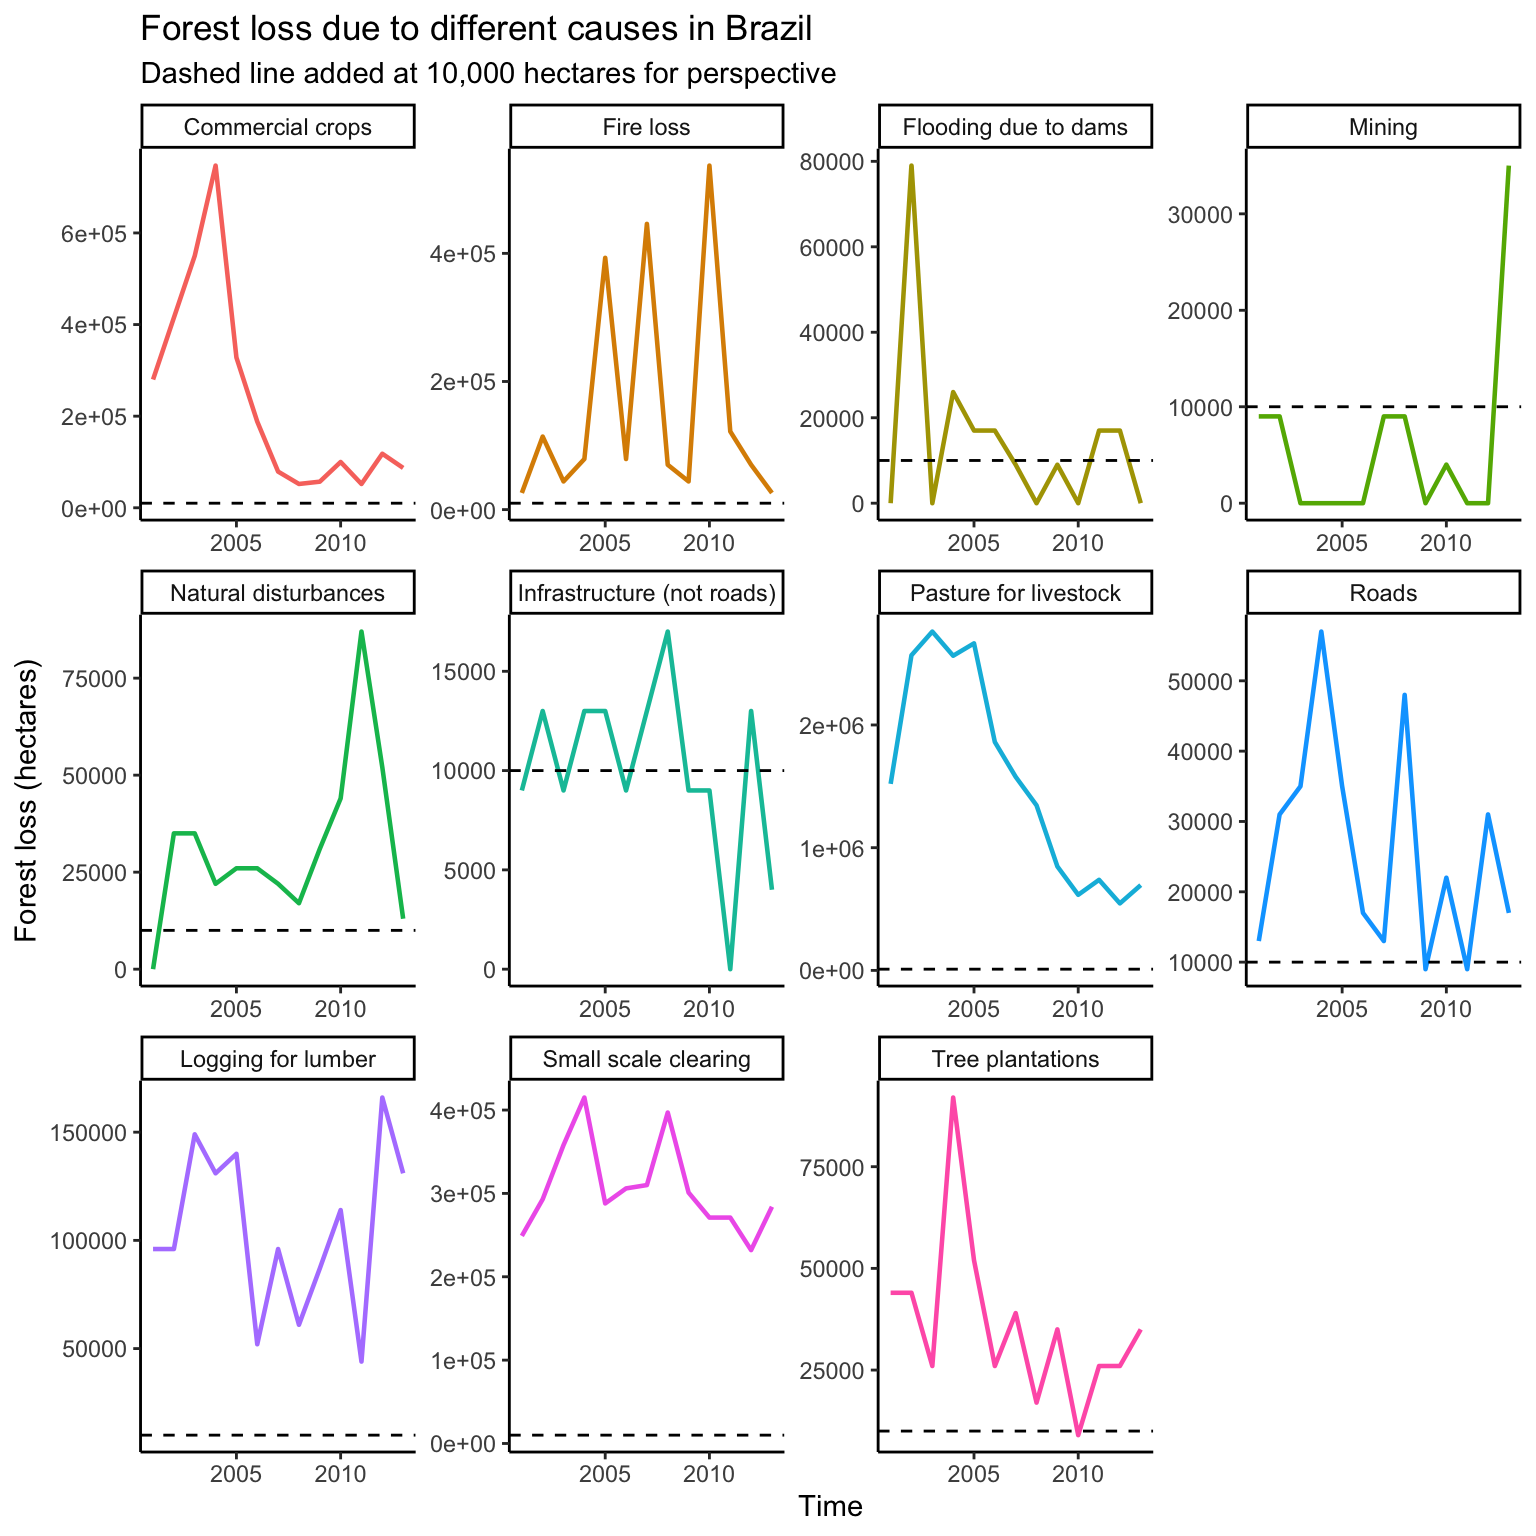
Plotting deforestation and its causes
Graphs and analysis using the #TidyTuesday data set for week 15 of 2021 (6/4/2021): "Global deforestation"
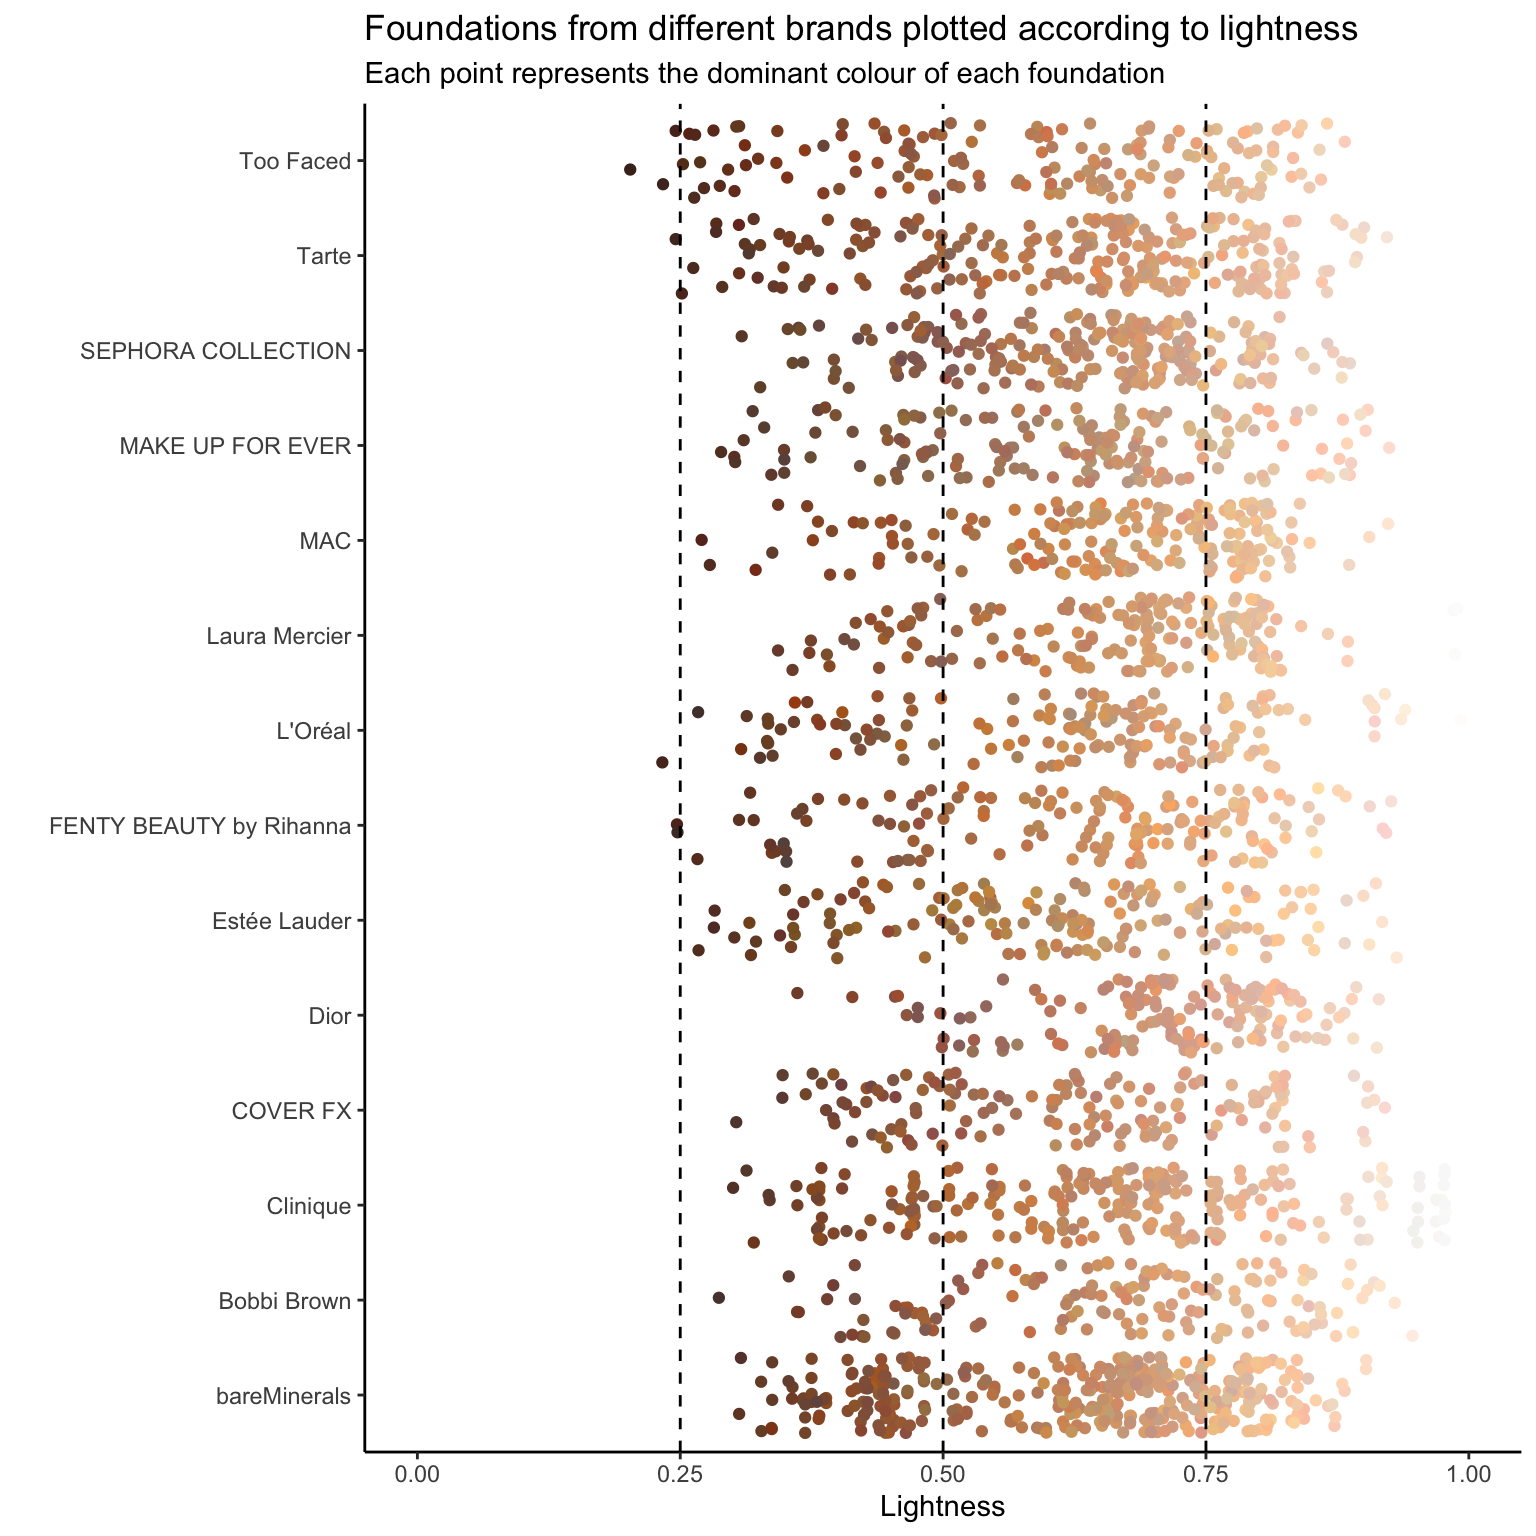
Plotting foundations according to shade
Graphs and analysis using the #TidyTuesday data set for week 14 of 2021 (30/3/2021): "Makeup Shades"
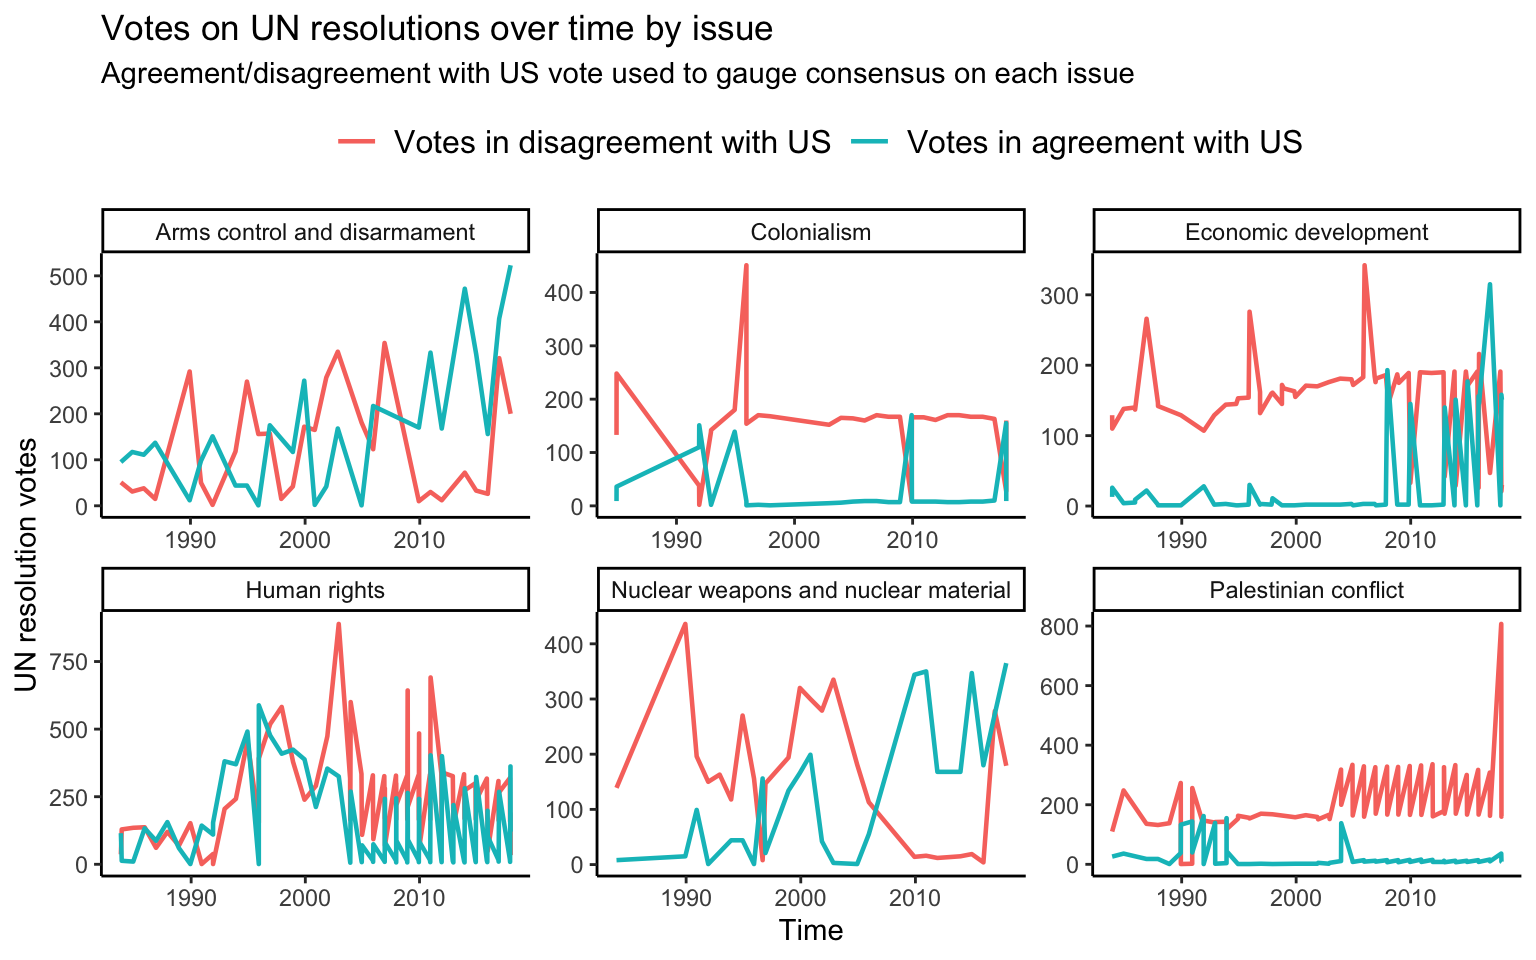
UN Votes: Plotting votes on United Nations resolutions
Graphs and analysis using the #TidyTuesday data set for week 13 of 2021 (23/3/2021): "UN Votes"
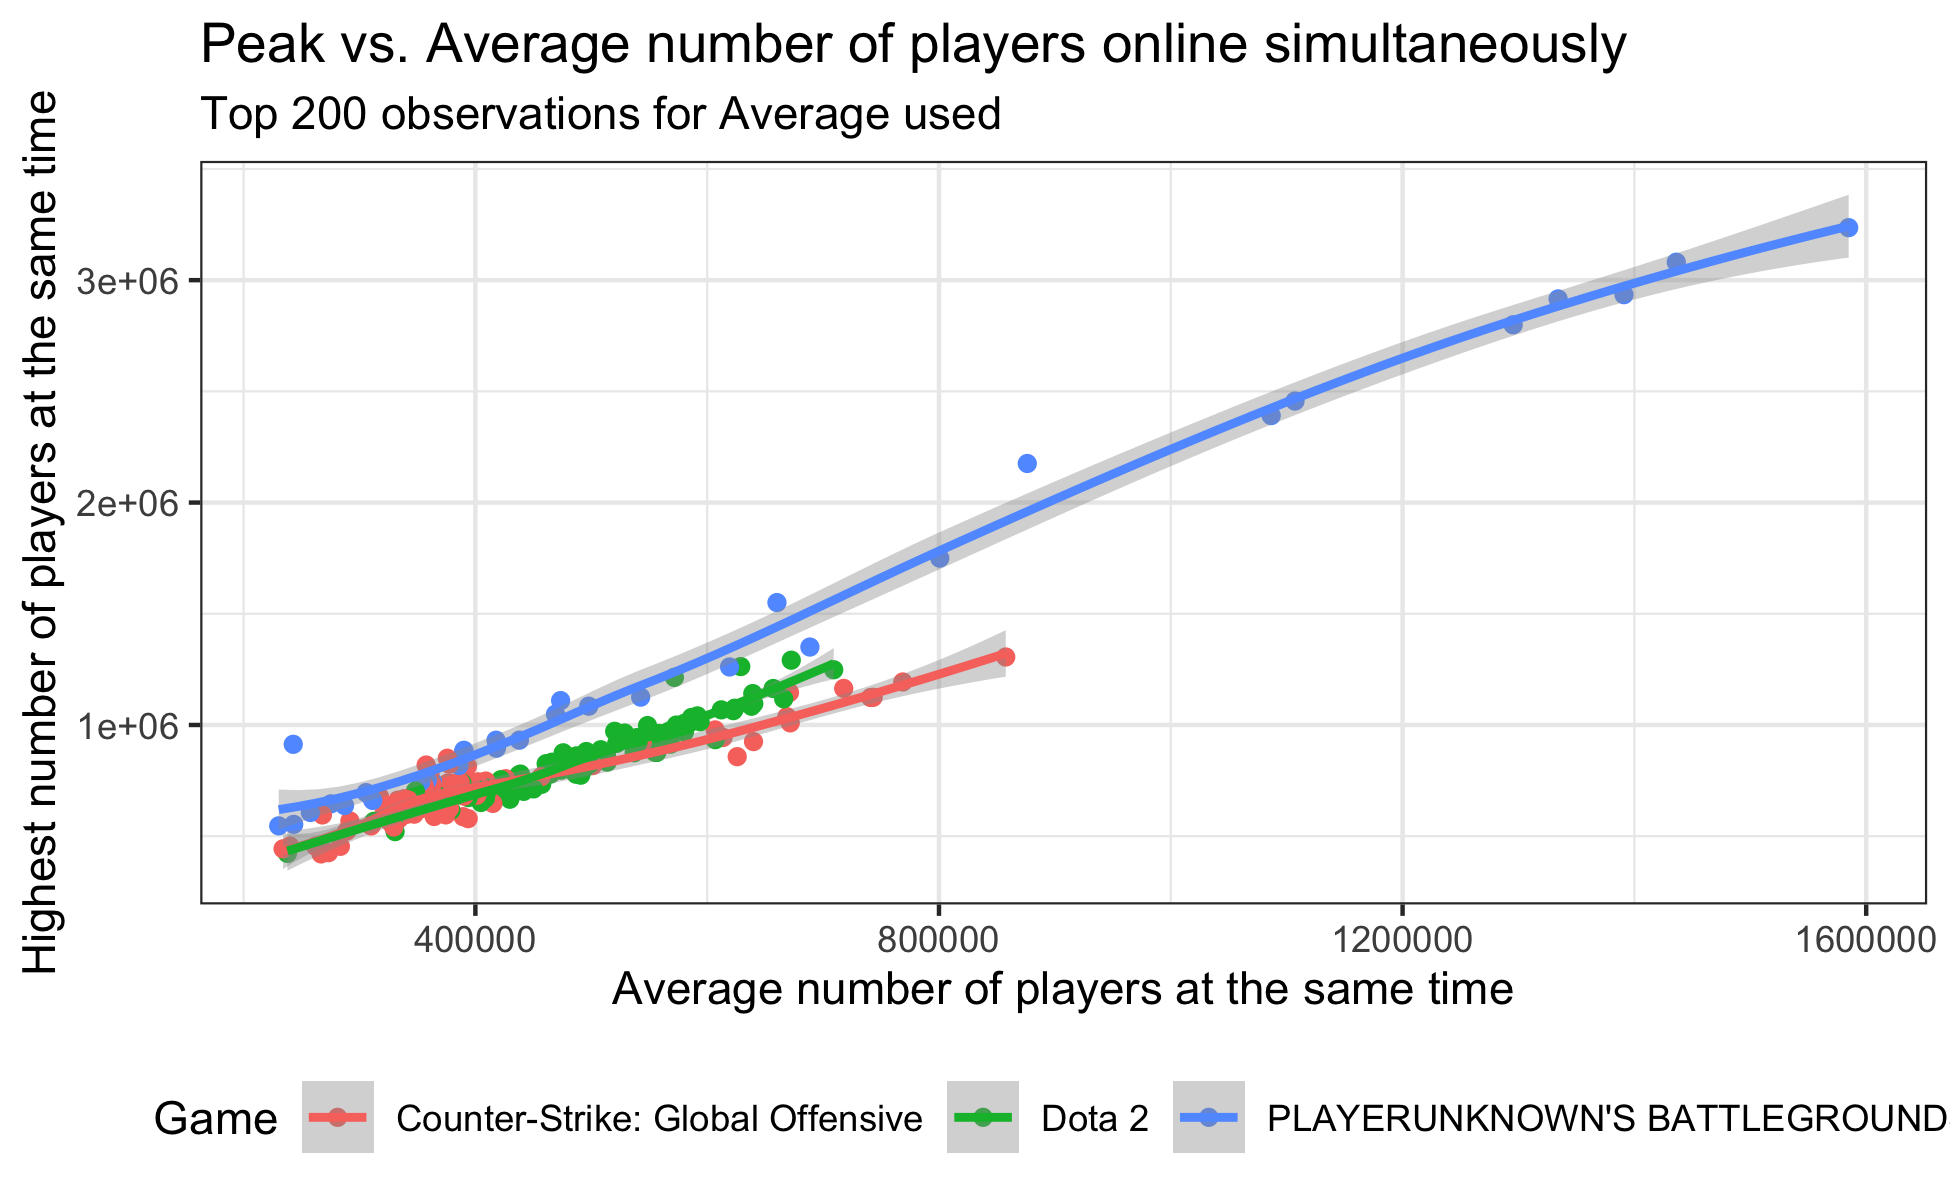
Video Games and Sliced
Graphs and analysis using the #TidyTuesday data set for week 12 of 2021 (16/3/2021): "Video Games and Sliced"
Bechdel Test
Graphs using the #TidyTuesday data set for week 11 of 2021 (9/3/2021): "Bechdel Test"
Welcome
Welcome to my TidyTuesday blog. This site features graphs and analysis of various data sets from the R for Data Science (R4DS) #TidyTuesday project.